What impact does the Federal Reserve have on mortgage rates?
Question of the week: What impact does the Federal Reserve have on mortgage rates?
Answer: Nerd alert—I got a bit too involved in this topic, my econ major came out. Towards the bottom I hope I simplified it for those looking for the Cliff notes version.
For most of its history the Federal Reserve had a very tangential impact on mortgage rates for home buyers and owners.
As discussed in the WR&MU, and elsewhere, the only interest rate the Fed controls is the Federal funds rate—which is the rate banks charge each other for overnight loans to cover reserves.
This rate trickles through the banks and into the financial system as if they are paying more or less for borrowing so will their clients. As well, the prime rate charged by banks typically moves in the same direction and amount as the Fed funds rate.
Investors use the comments by the Fed on what they believe the economy will be doing and guess if they will raise or lower rates, and then invest accordingly. These expectations result in their decisions on whether to buy or sell stocks, bonds, and mortgages.
For the last several decades, mortgage rates have been established in the open markets as investors bid on Mortgage-Backed Securities (MBS). These securities are bundles of mortgages that are packaged by lenders who sell direct to market, or for the vast majority, sold directly to Fannie Mae or Freddie Mac. Fannie and Freddie (GSEs) then package into bigger bundles and sell their MBS in the open market.
The bidding on the MBS determines mortgage rates. Higher MBS prices mean lower rates; lower MBS prices mean higher rates.
Mortgage rates are dependent on the market for Mortgage-Backed Securities.
Investors bids on MBS are directly correlated to the other options they have for their money. The investment instruments most like MBS are issued by the United States Treasury in short- medium- and long-term bills and bonds. If the Treasury is paying more to borrow money, investors will want mortgagees to pay more to borrow money, and vice-versa.
In any market, supply and demand determine prices. High demand against limited supply raises prices, low demand against high supply lowers prices, low demand-low supply and high demand-high supply generally keeps prices stable.
The only news from the Fed that is main-stream is its Fed funds rate and if the Fed will be raising or lowering the rate. Never, or very rarely reported, is how big the Federal Reserve is.
The charter for the Federal Reserve is to support maximum employment with minimal inflation—a difficult balancing act. For most of its history the Fed had primarily done this by using the funds rate. According to economic principles, higher rates would slow economy, lower inflation but increase unemployment; lower rates would stimulate economy, increase employment and prices.
In the 21st Century we have seen the Fed become much more aggressive in the trying to fulfill its charter by becoming very active in financial markets.
In response to the real estate and mortgage markets collapse in 2008 at the onset of the Great Recession, the Fed began a policy of “Quantitative Easing.” It began to buy trillions of dollars of fixed rate investments in an effort to lower rates in the markets and stimulate the economy.
Prior to the recession, in 2007, the Fed’s balance sheet was $900 billion dollars, virtually all of was Treasury bills and bonds.
Within one year the balance sheet increased to $2.2 trillion an increase of almost 2.5 times. As well, to prop up the mortgage and real estate markets, the Fed began buying MBS in 2008 with a purchase of $500 billion.
In 2007 the Fed funds rate was 4.75%, by the end of 2008 it was 0.25%, the largest drop in history in one year.
While the Fed funds rate remained at 0.25% until 2016, the balance sheet did not. The Fed kept purchasing Treasuries and MBS until it held a total of $4.5 trillion of the assets, including $1.75 trillion of MBS.
During this time, while the Fed funds rate remained flat, the 30-year fixed rate dropped from 6.65% in 2007 to a low of 3.68% in 2012. The primary cause was the Fed purchasing almost every conventional mortgage funded during the time frame.
In 2014 the Fed stopped actively buying new holdings, but reinvested the proceeds from Treasuries and MBS that were paying off to keep its balance sheet stable through 2018.
From 2017 to the pandemic in 2020, the Fed raised its fund rate from 0.25% in 2015 to 2.5% in 2019. In 2019 the Fed stopped reinvesting proceeds from Treasuries and MBS into more of each and its balance sheet began to shrink. During this time mortgage rates were fairly stable, increasing from 3.9% to a high of 4.57% back to 3.8%.
During the pandemic the Fed once again lowered it funds rate to 0.25% and began purchasing Treasuries and MBS. Rates dropped from 3.8% in 2019 to a low of 2.98% in 2021.
In 2022 as inflation spiked, the funds rate jumped from 0.25% in 2021 to 4.5% in 2022, reaching 5.5% in 2024. Spiking as well was the balance sheet with reached a peak of $8.9 trillion in 2022, including $2.7 trillion in mortgages.
Today the Fed fund rate is at 5.25%, it holds $7.3 trillion of Treasury debt and MBS ($2.1 trillion). The Fed funds rate is the same it was in 2006, when the 30-year fixed rate was 6.68% and the Fed held $850 billion in Treasuries, and no mortgages. Almost one decade later, the only change in these parameters is the dollar amount of investments the Fed holds and the price of real estate both climbed dramatically.
By purchasing $8.0 in Treasury debt and MBS from 2007 to 2022, the Fed was the demand in the market for those assets, pushing out most private and institutional investment. Higher demand means higher prices, means lower interest rates.
Where did the Fed get $8.0 trillion from 2007 to 2022 to purchase all those mortgages and Treasury debt? It created it.
The Fed does not print money, instead it electronically increases the reserve balance of a bank where it buys Treasuries or MBS.
Because the Fed created $8.0 trillion dollars, almost $5 trillion from 2019 to 2022, more money was flowing in the economy, which fueled inflation, and the need to lower rates.
Cliff Notes: While mortgage rates are influenced somewhat by the Fed funds rate as investors react to expectations for what the Fed, and economy, may do in the future; also having a major impact the last two decades has been the Fed’s buying trillions of dollars of Treasury debt and mortgages. These purchases had a dual effect of pushing rates down, but also creating environment during Covid when all the extra money it created caused very high inflation—which it then tried to fight by raising rates.
Looking at the chart below, you can see that the green-line (mortgage rates) somewhat follows the red-line (fed funds rate) until the end of the pandemic. At that time mortgage rates more closely followed the total amount of assets held by the Fed as it created trillions of dollars and pushed prices up.
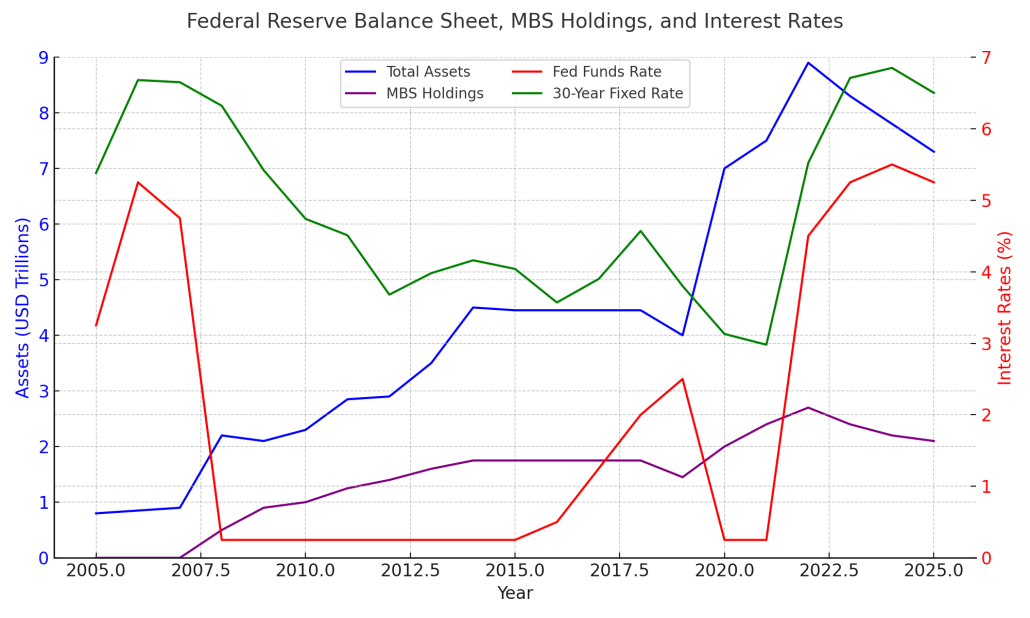
Looking ahead, as the Fed begins lowering its benchmark fed funds rate later this month, is what impact will the size of the Feds holdings have on the economy and rates. If it actively sells Treasuries and MBS, it can pull money out of the economy, slowing it and lowering inflation and rates. Or it can let the total amount of its holdings slowly decline by not reinvesting funds when mortgages and Treasuries pay off.
A lot of focus on the Fed rate moves overshadow the major impact the Fed has in it ability to create, or take away, money from the economy.
Have a question? Ask me!
Prices went up in August. The Consumer Price Index increased 0.4% in August, 2.9% from last August; both the monthly and annual rates were higher than July’s CPI. Even though CPI prices went away from the Fed’s 2% target, a rate cut by them next week is expected as an increase was expected, and expectations are that the Fed’s preferred inflation gauge, the Personal Consumption Expenditures index will be more benign.
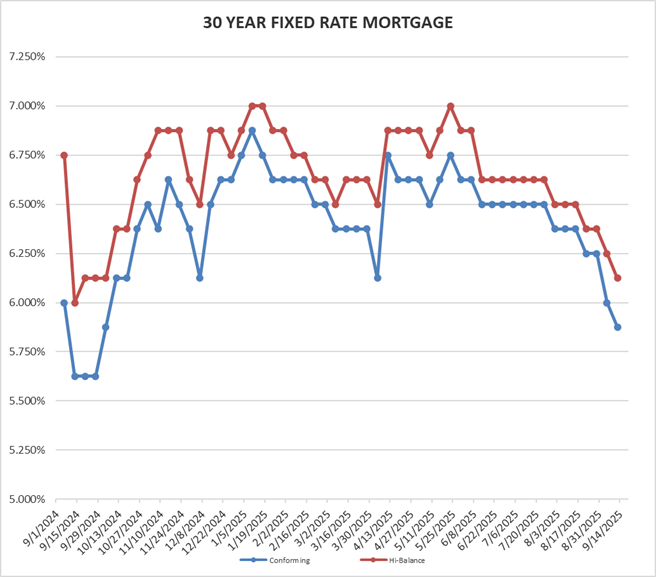
Rates for Friday September 12, 2025: Rates continue to slide down week to week, back to first step in the spike last September after rates had hit their lowest rate since December 2022.
FIXED RATE MORTGAGES AT COST OF 1.25 POINTS LOCKED FOR 45 DAYS:
30 year conforming 5.875% Down 0.125%
30 year high-balance conforming 6.125% Down 0.125%
Please note that these are base rates and adjustments may be added for condominiums, refinances, credit scores, loan to value, no impound account and period rate is locked. Rates are based on 20% down with 740 FICO score for purchase mortgages.
On Tuesday California celebrated its septaquintaquinquecentennial, or for those who prefer short cuts, our dodrans bicentennial (Latin for three-quarters of the way to 200).
For those who did not get past mille in Latin class, Tuesday was the 175th anniversary of California being admitted as the 31st state in the union.
In our 175 years we have had four state capitals, San Jose (1850-51), Vallejo (1852-53), Benicia (1853-1854) and Sacramento since 1854.
Our population has increased from 92,597 at statehood to 39.6 million today. As our population grew, so too did our desire for more local control, expanding from originally 27 counties to 58 today—with San Bernardino being the largest in the nation, larger than nine states.
Happy Birthday to us!