


Is the housing market collapsing?
For those who did not click through to survey in last week’s WR&MU please do so for better poll results! Here is link, should take less than three minutes: https://s.surveyplanet.com/0xbb1zby
Question of the week: Is the housing market collapsing?
Answer: Not according to data, but don’t tell the media that.
This week’s question is the result of article in our local Press-Telegram with the headline, “Southern California’s housing collapse.”
Reading the headline, I immediately thought what a shame it is that most of those in the media (and elected office) are not very good at analyzing data. In this case the writer’s columns are all about data, and has been calling for housing prices to crash since 2020 and he presents data to support his position.
In this case the overall data does not support his position of housing market collapse. The simple reason is that reduced sales are not the same as reduced prices—in fact in many cases lower sales lead to higher prices. Housing markets are defined by prices, not by units sold. Let’s look at the data from August sales from the California Association of Realtors.
Before we address sales and price data, let’s look at two data sets that reflect where a housing market is headed, unsold inventory and median days on market.
Unsold inventory is the how long it would take for current properties on the market to be sold under current sales conditions. For example, if there are 100 homes on the market and 25 homes per month are being sold, the unsold inventory index is four months. In a market with moderate price increases unsold inventory is around six months. If the unsold inventory trends lower it generally indicates upward pressure on prices, if longer the pressure is for lower pressures.
Statewide, in August, the unsold inventory index was 2.9 months. In the Southern California region (Los Angeles, Orange, Riverside, San Bernardino, San Diego and Ventura Counties) the index was 3-months. This data indicates that there is still a low amount of inventory on the market compared to “normal” markets.
Median days on the market (DOM), is the amount of time it takes for a property to be sold from when it hits the market. If Leslie and I put our home on the market on October 1st and he open escrow on October 20th, the DOM is twenty days. (A quick math primer, the “median” amount is the number right in the middle between the highest and lowest in the data—the median of 1, 2, 3, 4, 5 is 3. In large data sets the “average” and the “median” can be close, but rarely are, the same.)
In “normal” markets the median DOM is typically around 30-days. Analyzing the data from January 2010, when market was coming out of the Great Recession, to February 2020, just before the Pandemic Market, the median DOM was 34.5 days from market to escrow in California, for Southern California Counties in the same period the median DOM was 38.5, not a big difference.
The August median DOM statewide was 19-days, last August it was 9-days. Southern California Counties median DOM was 18-days in August, up from 9-days in August 2021.
Shorter DOM indicate a market in which properties are going to escrow faster and should result in upward pressure on prices, longer DOM are typically associated with downward pressure on prices.
From the CAR website, here are the price and sales data for all of California, and LA and Orange Counties.

As you can see the median price had slight increases across the State and in LA County, up 0.7% and 1.0% respectively from July; Orange County saw a decline of 2.5% in the median price, which represents a drop from $1,231,000 to $1,200,000. All three areas saw an increase in median prices from August 2021, with the OC up $100,000 from last year.
Across all three areas the number of sales in August were up from July, in large part due to the dip in rates in August. As you can see the total number of sales we down considerably, essentially 30% in LA and Orange Counties, from August 2021. It is this number that is the basis for the columnist mentioned above stating the market is “collapsing.”
While the total number of sales are down, the unsold inventory and DOM data show the market is still somewhat warm. The slow down in price increases month to month indicate that equilibrium is present as sellers and buyers seem to agree the asking price from the seller is seen as a fair value to the buyer.
Also supporting this analysis is in Southern California Counties the sold price in August averaged 98.7% of list price—a sign that sellers are pricing their properties to sell, as supported by the relatively short time their homes are on the market before being sold.
Statewide every region but two, Far North (-1.8%) and San Francisco Bay Area (-1.2%), show prices increases from August 2021 to August 2022. The highest being an 8.7% increase in the Inland Empire, the lowest being 2.2% in the Central Valley
Might the housing markets “collapse,” which I would define as a drop of 15% or more of prices? Sure, they might. But the current data does not support such a collapse under current market conditions. Note “current.” As we have seen, singular events can have a tremendous, and quick, impact of markets. Despite historic spike in mortgage rates and turbulent economic data (see below for some) housing markets in 2022 have thus far been resilient, avoiding collapse as the market gently eases from a complete sellers’ market to a more balanced market between buyers and sellers.
One more note, to the one of the points the columnist made in the doomsday article, the cost of the median price has gone up considerably due to higher rates. In August 2021 the median priced home in LA County was $830,070. To purchase the home with 20% down ($166,000), when the average interest rate for a 30-year mortgage was 2.625%, the monthly payment was $2667. For the median LA County home in 2021, the down payment only increased by $5000 to $171,000, but with the average rate in August at 5.06%, the monthly payment increase from a year ago is 39%, to $3697 per month.
That 39% increase in payment has slowed sales, and price increases, but prices are somewhat flat from a year ago despite rates more than doubling.
Have a question? Ask me!
Data this week shows confirmed that GDP shrank in 1st and 2nd quarters, inflation is not abating, consumers are spending less, and workers wages are increasing below inflation. Through this the job market is still tight with layoffs at a record low and companies still hiring as many workers as they can despite all this information and recession possibly worsening.
When measuring inflation, the Fed uses the PCE index, rather than CPI as it shows changes in consumers buying habits due to prices. In August the overall PCE rate increase a modest 0.3%, however that number was pulled down when gas prices dropped in August. Taking out volatile food and energy costs, the “core” rate increased at a 0.6% clip, higher than expected. Year over year prices are up 6.2%, down from July’s 6.4% annual increase. The price data indicates that the policies from the Fed are not having a discernable impact on inflation, which supports more large increases in their benchmark rate in the future.
The Commerce Department data release today on consumer spending showed an increase of 0.4% from July, however adjustments to July’s data showed a decline in spending from June. Adjusting for inflation spending was up a scant 0.1% for the month. Consumer spending is approximately 70% of our economy, slower spending portends even slower economic growth. August incomes rose 0.3% for the month, and continues to increase less than inflation. Employers need workers, workers want more pay to fill open jobs, companies need to hold prices as much as they can to capture consumers’ dollars. What breaks in this cycle, when will it break, and what will be the fallout from the break? Those are the literal multi-billion dollar questions.
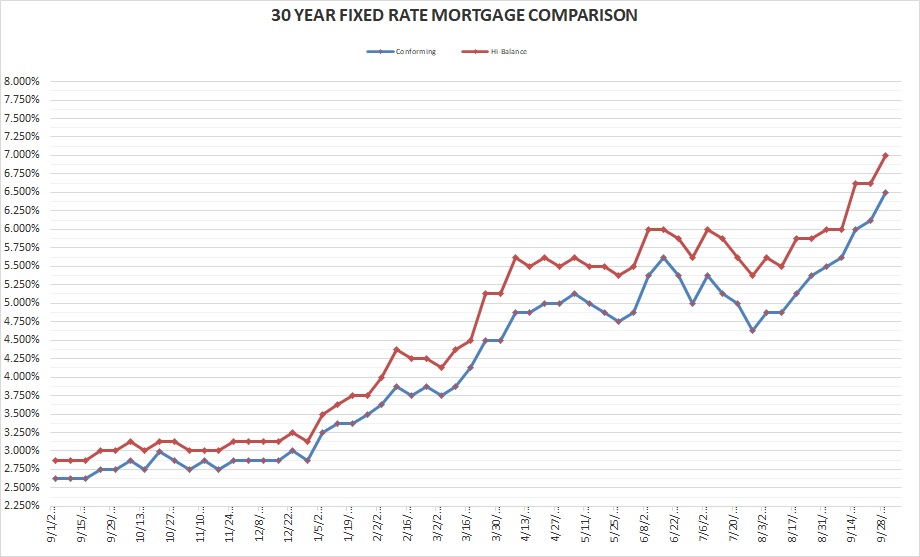
Rates for Friday September 30, 2022: The week opened with a major drop in prices for Mortgage-Backed Securities (determine mortgage rates), causing a spike in rates. The data mentioned above puts more upward pressure on rates with little sign of when the data will support lower rates. This week the 30-year mortgage hits its highest level since the middle of 2007. Those who locked in rates last month at or below 5% are pretty happy they did so.
FIXED RATE MORTGAGES AT COST OF 1.25 POINTS LOCKED FOR 45 DAYS FOR PURCHASE TRANSACTIONS:
30-year conforming 6.50% Up 0.375%
30-year high-balance conforming 7.00% Up 0.375%
Please note that these are base rates and adjustments may be added for condominiums, refinances, credit scores, loan to value, no impound account and period rate is locked. Rates are based on 20% down with 740 FICO score for purchase mortgages.
In case you missed the message above because you scroll right to this section of the WR&MU, if you have not already done so, please click on this link to complete quick, 2–3-minute, survey for me: https://s.surveyplanet.com/0xbb1zby
It almost feels like my favorite season is here in reality instead of already being here technically. Walking the dog with a pull-over on in the morning, planning for what my mom called “on-off days” as you put on then take off a sweater or jacket, nights without all the windows open and two fans going…not to mention baseball playoffs, football well underway and the NHL and NBA getting ready!
Have a great week,
Dennis
Past Weekly Rate & Market Updates can be found on my blog page at my website www.DennisCSmith.com/my-blog


