

How do Fed moves impact mortgages and housing?
Question of the week: How do Fed moves impact mortgages and housing?
Answer: Today’s WR&MU may get a bit into the weeds and a little technical for some readers. I will do my best to write in simple English and broad-stroke explanations. I hope you stick with our answer section as it may clarify for you the relationship between the Federal Reserve, our economy, interest rates, and therefore our housing markets.
The Federal Reserve’s stated purpose is, “Conducting the nation’s monetary policy by influencing money and credit conditions in the economy in pursuit off full employment and stable prices.”
Very simply, monetary policy is controlling how much money is in the economy. Increasing the amount of money increases economic activity, decreasing the amount of money suppresses economic activity. The Fed has several tools available to increase or decrease the amount of money in the economy.
“Full employment” and “stable prices” are not mutually compatible in a natural state. If everyone is employed there is more money circulating in the economy as workers purchase goods and services. Full employment results in greater demand for goods and services, which puts upward pressure on prices, i.e. inflation. Less than full employment decreases overall purchasing power and ability. Lower demand leads to stable, or declining prices.
While the Fed’s purpose is full employment and stable prices, its objectives for a constant economic growth and stability are targets of around 2% of inflation and the amount of employment to sustain that target. When met the economy should grow at 2-3% per year, enough to absorb the influx of new workers into the economy.
Contrary to what many believe, the Federal Reserve only controls one interest rate, the federal funds rate (referred to often as the “benchmark rate”). This is the rate that banks lend money to each other, typically on an overnight basis.
Banks lend and borrow money overnight to ensure they have the cash reserves as a percentage of deposits to meet the requirements set by the Fed; currently banks and other depository institutions are required to have reserves equal to 10% of their demand and checking deposits.
If the Fed increases or lowers the amount of the rate banks must pay to borrow money from other banks to achieve their reserve requirements, banks in turn increase or lower the rates they charge their borrowers, or pay their depositors.
Mortgages are considered a fixed rate assets. You borrow money to purchase your home with a mortgage and agree to pay a certain interest rate. An investor will purchase that mortgage because they want to receive that rate of interest on a regular basis as part of their investment portfolio.
Mortgage rates are determined by investors who purchase mortgages as an investment. The mortgage market is generically known as MBS, or mortgage-backed-securities. Investors want to make a profit, their decisions to purchase or not purchase any investment is based upon their opinion as to what they think will happen in the future and if their investment will be worth more or less money. In the case of MBS, this includes what they feel interest rates will be, or should be, in the future.
Part of their decision-making criteria is what they feel the Fed will do in regards to monetary policy, or what the Fed has announced it will do.
One more factor impacting mortgage rates is what other investments are available at what return to investors. The primary competitors for mortgages are other fixed rate assets, such as corporate bonds, and most notably government bonds and notes.
Because of their long-term nature and relative low risk, the benchmark alternative to MBS is debt issued by the United States Treasury in the form of short- or long-term notes or bonds. The United States has never defaulted on any note or bond, and is therefore considered the safest investment in the world. As a result, it generally pays the lowest interest rate in the market for similar investments due to the almost complete lack of risk.
Back to the Federal Reserve. The two primary tools available to the Fed to achieve its purpose are the fed funds rate, and the purchase or sale of assets on its balance sheet. For decades the Fed held on its balance sheet almost exclusively U.S. Treasury debt (henceforth UST).
When the economic crisis of 2008 hit the Fed announced it would commence “quantitative easing.” This is a process where the Fed enters the market and purchases fixed rate assets. In the past this would be buying short- and long-term UST debt. This has the impact of stabilizing, or lowering, interest rates as the Fed’s entry into the market instantly reduces demand as it edges out other investors, which in turn creates lower rates.
Sidebar: Long term readers of the WR&MU know that in the fixed rate asset markets higher prices mean lower rate and lower prices mean lower rates. I.e., if you purchase a $1000 bond for $990 you will receive a higher return on your investment that if you purchased the $1000 bond for $1010)
When it announced its quantitative easing (QE) program in 2008, the Fed stated it would be purchasing not only billions of dollars of UST every month, but also MBS to shore up the housing markets by pushing mortgage rates down. The Fed proceeded to engage in QE1, 2, 3, and 4 over a period of a few years.
In August 2008, before it began QE1, the Fed’s balance sheet was $910 billion dollars. By the end of 2014, after several years of purchasing UST and MBS, and thereby keeping rates relatively low, the Fed’s balance sheet had ballooned to $4.5 trillion.
At that time the Fed stopped purchasing new issues of UST and MBS and maintained a fairly stable balance sheet by purchasing UST and MBS with funds received when those assets matured or paid off as home sold or mortgages refinanced.
In response to the economic impact of the Covid-19 virus in March of 2020, the Fed slashed its benchmark rate to near zero (borrowing rate 0.00% – 0.25%) and initiated another QE program to purchased UST and MBS. This was to push more money into the economy and drop interest rates to encourage borrowing and economic activity.
In February 2020 the Fed balance sheet of UST and MBS was $4.17 trillion, by the end of March 2022 that amount had more than double to $8.96 trillion. This amounted to about one-third of all UST and MBS debt issued.
By March the Consumer Price Index had reached 8.5%. The Fed’s objective of “stable prices” was far from being met. Action was required by the Fed to stabilize prices. Not mentioned was achieve maximum employment.
Using its primary tool, the Fed funds rate, the Fed began raising its benchmark rate in March, raising it from an average of 0.08% to 0.33%. With inflation running so high, investors were anticipating several hikes in the rate through the year, and this was supported by announcements from the Fed as to its expected schedule of rate hikes. (It should be noted the Fed tries to signal its intentions so as not to shock markets.)
The opposite of quantitative easing is quantitative tightening (QT). The QT process involves the Fed “unwinding” its balance sheet by purchasing new UST or MBS when similar assets payoff at maturity or refinance. This reduces demand in the market, reduced demand leads to higher rates as prices drop.
Quantitative Easing (QE), the Fed lowers demand in the markets and results in lower rates as the Fed purchases fixed rate assets from the U.S. Treasury and Mortgage-Backed Security markets. Quantitative Tightening (QT), the Fed increases supply in the markets results in higher rates as the Fed withdraws from the UST and MBS markets and/or sells off those assets on its balance sheet.
In May 2022 the Fed announced it would begin a QT program to combat inflation in addition to continuing to increase its benchmark rate. One part of the QT would be the Fed letting almost $1 trillion worth of assets mature without reinvesting the funds into more UST and MBS over the next twelve months.
The other part of the QT would be the Fed actively selling UST and MBS on a monthly basis on the open market. Starting slowly in May, the Fed began selling tens of billions of assets on the open markets. In September the schedule increased to $95 billion being sold each month.
The markets must now absorb not only the continuing debt issues from the Treasury, increasing considerably with the several trillions of dollars of spending passed in legislation over the past year or more, and new mortgages being funded, but also absorb the $95 billion per month being sold by the Fed.
This additional supply into a market that was lacking sufficient demand has put constant upward pressure on interest rates.
As simple example. Bob wants to open a bike shop but need to borrow $10,000 to do so. He puts an ad in the paper, “Need to borrow $10,000.” There are no other ads for people wanting to borrow money, so several people looking to make some money with an investment contact Bob with offers to make the loan. Telling each potential investor what the others will charge results in Bob being able to get a low interest rate, 3.00%.
A few years later Bob wants to expand into another city. He puts and ad in the paper, “Need to borrow $10,000.” He receives not response, and looking in the paper sees why, there are twenty similar ads. He makes a new ad, “Need to borrow $10,000, will pay 6% or market rate.” He has a few people call and offer varying rates, saying what rates other potential borrowers are offering. Bob borrows the $10,000 at 6.75%.
The Fed has impacted the mortgage rate markets in a few ways. First, with their predictions of the economy and their stated intention of rate increases and targets have investors looking forward to how high rates may, should, go for the Fed to impact inflation and cause it to slow and drop.
Second, with its increasing the benchmark rate the Fed is having a trickle effect through the economy as banks charge more to their borrowers through increasing their prime rates, credit card rates, auto loan rates, etc.
Third, and the most under-reported but the most impactful, is the quantitative tightening process that is increasing the supply of Mortgage-Backed Securities on the market, against which new mortgage offerings from lenders will have to compete.
We discussed the increase in the Fed balance sheet since the beginning of the pandemic, and the Fed’s plan to reduce it by putting over $2 trillion over a 12-month period into the markets, what about rates?
As mentioned above, the Fed funds rate was below 1% in the beginning of March, before the Fed began its schedule of rate increases. At that time the prime rate (basis for Home Equity Lines) was 3.50%. Today the funds rate averages 3.33% and the prime rate is at 5.50%. Next week, both rates will increase by 0.75% (funds to 4.08%, prime to 6.25%). The expectation is that there will be two more increases this year, totaling 1-1.5% before December.
The Fed has indicated it expects there to be “pain” in the labor markets, i.e. layoffs and higher unemployment, as its monetary policy pushes rates higher and reduces the amount of money in the economy. Fighting inflation is a higher priority in meeting its stated purpose than maximum employment.
A large, and growing, concern for many is that the continued monthly sale of large amounts of UST and MBS, combined with the continued issuance of debt, particularly from Washington, is putting too much stress on our banking system and can, will, lead to a cash crisis as banks and dealers only have so much capacity to purchase, and retain with so few buyers, additional debt.
Some of suggested that the Fed adjust its QT program to retain mortgages, perhaps re-enter the market to purchase excess supply thereby stabilizing mortgage rates, to ease the financial strain on banks.
Looking forward, with the Fed moves thus far having no impact on inflation, or labor markets, rates will continue to increase as the battle against inflation continues. The higher rates are already having an impact on residential real estate markets as markets have transitioned from sellers towards buyers, with prices supported more from lack of inventory than an increase in demand.
Have a question? Ask me!
Inflation data was mixed, but not, for August. The Consumer Price Index for all goods and services showed an increase of only 0.1% for the month, and a decline year over year of inflation from 8.5% to 8.3%. This should be great news and put a little downward pressure on rates. However…the “core” rate blew up the data. The core rate is the CPI data less food and energy; these items are extracted because they are generally more unstable than other goods and services. The core rate was a very high 0.6% for August. Gas prices dropped 10.6% in August, almost solely accounting for the relatively flat change in prices. Of particular concern in the data were the increases in groceries (+13.5% year over year), medical (+5.4%) and housing up 0.7% month over month.
Markets reacted very negatively to the report due to the large influence gas prices had on reducing CPI, and the vulnerability if/when gas prices increase in the future when demand for heating fuel and gas increases in the winter. The average American household spending $460 more per month for same goods and services as last year, even with gas prices on the decline. That number will continue to climb with inflation, and higher costs due to the need to heat homes in the winter.
Consumers didn’t seem to mind what is happening in the economy, and evidently feel pretty secure in their jobs and income. Retail sales increased 0.3% in August after adjustments for inflation. Driving sales were vehicles and dining out, two categories that are reflective of consumers attitudes to the economy and their future. Workers pay adjusted for inflation has increased for the past two months, though down 2.3% from last August.
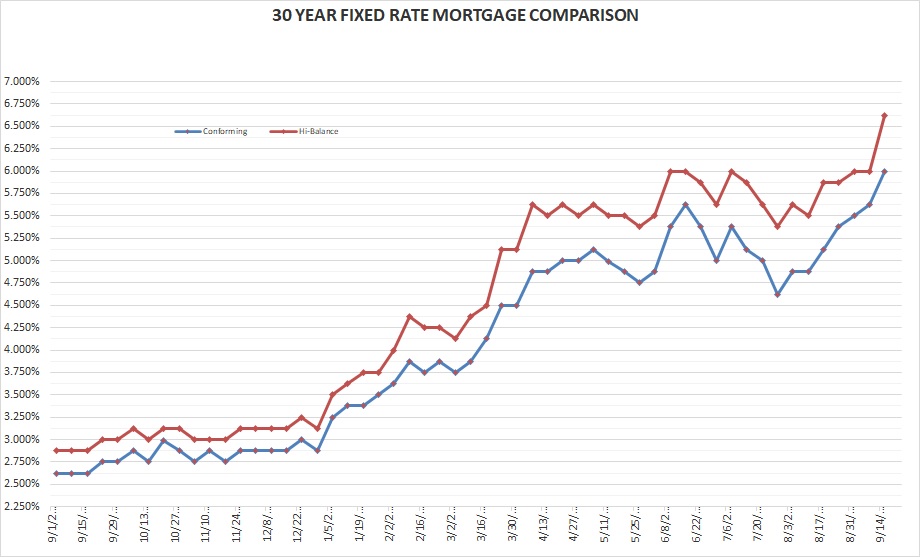
Rates for Friday September 16, 2022: Rates spiked this week on a combination of the inflation news and looking ahead to moves by the Fed before the end of the year to increase rates with three large rate bumps. The conforming rate has its largest one-week increase since June, the high-balance increase is the largest since March.
FIXED RATE MORTGAGES AT COST OF 1.25 POINTS LOCKED FOR 45 DAYS FOR PURCHASE TRANSACTIONS:
30-year conforming 6.00% Up 0.375%
30-year high-balance conforming 6.625% Up 0.625%
Please note that these are base rates and adjustments may be added for condominiums, refinances, credit scores, loan to value, no impound account and period rate is locked. Rates are based on 20% down with 740 FICO score for purchase mortgages.
Technically, summer comes to an end next week. This morning driving to the gym at 6:45 the dashboard thermometer read 61°, it almost feels like fall is here six days early!
Have a great week,
Dennis
Past Weekly Rate & Market Updates can be found on my blog page at my website www.DennisCSmith.com/my-blog


