


Survey Results from poll on economy and housing
Question of the week: What were the results of your poll on housing market and the economy?
Answer: Before we get to data, thank you to all who responded. It appears that respondents were a pretty good cross section of the WR&MU email list, plus several who clicked on from posting on social media and my website.
Respondents were from as far north as San Luis Obispo, south to San Diego County, and east to Palm Springs/Desert area. Not surprising given where our home is, as well as where many of my referral sources and clients live and work, that the 65% of the respondents were from the 908xx zip codes (i.e. Long Beach).
The two highest categories for type of employment or income source were those are salaried on an annual basis and retired, each composing 24% of respondents. Given that I have been in the industry since 1987, and creeping up on eligibility for Medicare and Social Security, the high percentage of retirees was not a surprise—plus many of them obviously need more to do on Fridays than read the WR&MU!
Other areas responding were 15% in real estate or affiliated industries, 15% in two income families, and 12% in professional fields of accounting, legal or financial industries. The remaining respondents were hourly wage earners or preferred not to answer the question.
The overwhelming majority of respondents have owned their current homes for 10-years or more 71%. The next two highest respondent categories at 12.5% each were owners for less than 3-years, or from 7-10 years. Not surprising given how most people get on the email list for the WR&MU, 90% of respondents own their own home, to the other 10%, let’s talk about your plan to buy in the future!
When it comes to real estate values in the coming year in respondents’ areas, 54% feel prices will drop. The largest response for the question was 31% feel values in their area will drop up to 5%, the second largest response were the 23% who feel prices will drop more than 5%.
The optimists 35% of respondents feel prices in their areas will increase over the next year, with 19% estimating up to 5% and 15% estimating more than 5%. What is interesting about those who feel prices will increase more than 5%, all of them live in high-value/income areas. Counter to others in the neighborhood(s), 20% of those in similar areas feel prices will decline more than 5% in their area.
Fifteen percent stated that were considering purchasing a new home within the next one to two years in January. Twenty-five percent of these respondents have already purchased their new home this year, almost all of them before rates climbed to 5% at the end of April.
Of those who have not yet purchased, most cited prices rather than rates as the primary reason, with 75% stating they are waiting for prices to fall, and 25% feel rates are too high to purchase. This cohort of respondents are hopeful that the 53% who feel rates will decrease are correct.
The results of the question, “How concerned are you about inflation impacting your family in the next 6-months” we a bit surprising to me. Sixty-five percent of respondents replied they were not very concerned, 35% were very concerned. Breaking down the data for source of income respondents, almost one-third of the “not concerned” respondents are retired. Only about one-third of retirees are very concerned about inflation and the impact on their families.
The cohort that is most concerned about inflation is the two-income family group with 40% of them very concerned about inflation and its impact.
Looking at this data, the interesting aspect is that most retirees are on fixed incomes, which is obviously eroded by inflation. While this is also true for wage and salary earners, generally this group receives salary and wage increases at a greater rate than retirees. Another view of this is many two-income families have children and attendant expenses, whether growing out of clothes every year, or more fully grown and additional expenses for education, etc.
Overall, I was anticipating a greater number of respondents being concerned about the impact inflation is and will have on their families.
More respondents are concerned that the Fed’s battle against inflation will result in a recession that will negatively impact their family, but still not a majority of responses showed concern. Almost 54% said they were not very concerned about a possible recession and it having a negative impact, while 46% are very concerned. Breaking it down vis-à-vis inflation, 12% more respondents are concerned about a future economic event that may negatively impact their families than those who feel a current economic event will have a negative impact.
The retirees were evenly split on being concerned or not about a recession having a negative impact; like the overall responses more retirees are concerned about the possible future recession than the current inflationary economy. Two-income families were very consistent with the same 60%-40% split being not very concerned and very concerned respectively.
The highest percentage of respondents who are very concerned about the Fed’s action resulting in a recession that could harm their families were those in real estate or affiliated industries, with 75%. I’m guessing these responses are mainly focused on the run up in interest rates that could lead to a recession resulting in declining home sales.
Those least concerned with a potential recession and a negative impact were salaried income earners, with 75% indicating they are not very concerned.
Looking at the results of the question, “Do inflation, interest rates, housing markets influence how you may vote in November,” I realize I may have worded that differently and had a different result. The way the question is worded a “no” vote could mean that respondent is not happy with what is happening but their vote is not changing as they intend to vote the same way regardless of the variables provided—likely due to party affiliation. All that said, respondents hit exactly 50% on each answer as to whether the factors listed influence how they intend to vote next month. This is the only category that no matter how I looked at the data, from zip codes, to source of income, the results were at or very near a perfect split.
I wanted to shy away from politics in the question, doing so did not really show much. Perhaps if I had asked if the factors will influence you to vote differently than you normally vote—i.e. switch parties or consider the economic variable before other issues they usually depend upon.
The final question regarding the economy and impact on families, “One year from now, September 2023, do you think your family’s financial situation will be…about the same, somewhat better, much better, somewhat worse, much worse” had almost half, 48%, indicate they feel their situation will be about the same.
No respondents feel they will be much worse off next year, but 28% feel they will be somewhat more worse off than today. On the optimistic side of the scale, 16% feel they will be somewhat better off and 8% feel they will be in a much better financial situation next September.
Echoing their greater concern about recession (50%) than inflation (33%), half of retirees feel they will be in a worse situation next year, this group makes up about 57% of those who replied they see themselves as worse off in one year.
Showing the age of readers of the WR&MU, or at least respondents—as if the percentage of respondents who are retirees and homeowners of current residence for at least then years was not enough—were the replies to where people go to get information for financial markets and news.
The number one answer was television, with 26% of respondents. As this was a category where more than one answer could be selected, this answer also shows almost three-quarters do not rely on television for their news.
Granted the question did not asked how they received their newspapers, but that was the second highest answer with 23%. With newspaper advertising being considerably cheaper than television advertising, for our group it seems a lot more bang for the advertisers to go with the original mass media of newspapers.
Not surprising was that social media was the third category, but lower than I expected given the mediocre responses for t.v. and newspapers, with only 13% scrolling social media and clicking on articles and media for financial news and information. The remaining responses were all near or below 10%.
Thank to those who responded the Weekly Rate & Market Update was a primary source!
Wrapping up, in the comments many indicate that tougher times are coming before the economy improves—which was interesting in that the majority do not feel that inflation and/or possible recession will not have a negative impact on them and their families. I take this as good news that the respondents are, mostly, financially secure and optimistic about the future.
As well, this likely shows that homeowners feel this security, in part, because of their homeownership. The stability in housing and for the most part monthly costs is likely a contributor as they know they where they will be living and what it will cost.
In closing, Anonymous from Westminster left this comment, which I think you will agree is perfect, “Buy what you NEED, save what you can and turn off the news. We will get through this.”
Great advice Anonymous!
Have a question? Ask me!
First Friday means Jobs Friday, as the Labor Department releases data on September employment figures. The economy added 263,000 jobs last month, the lowest total in a year and well below the 439,000 per month average since the start of the year. Wages gained 0.4% for the fifth straight month, and are up 5% from last September—well below inflation. Despite the drop in new jobs, the unemployment rate contracted to 3.5% due to a smaller labor pool. The Fed is anticipating that the unemployment rate will increase to 4.4% in 2023 as it fights inflation and slows the economy.
With the number of job openings having 2nd largest decline in history from July to August, from 11.2 million to 10 million, and layoffs being the most in 18-months, combined with slower total job growth, the data shows a slowing in labor markets. In normal economic times, this information would push rates lowers as investors see the slowing labor markets leading to a slowing, shrinking, economy. In our current environment this is not the case. With the Fed intent on pushing inflation down to its 2% target, and publicly stating that they foresee up to four million jobs being lost in the fight against rising prices, the data is not enough for the Fed to raise its benchmark rate another 0.75% in November. With five rate increases totaling 3% since March, the Fed is expected to raise its rate two more time in 2022 for another 1.25 – 1.50% in total.
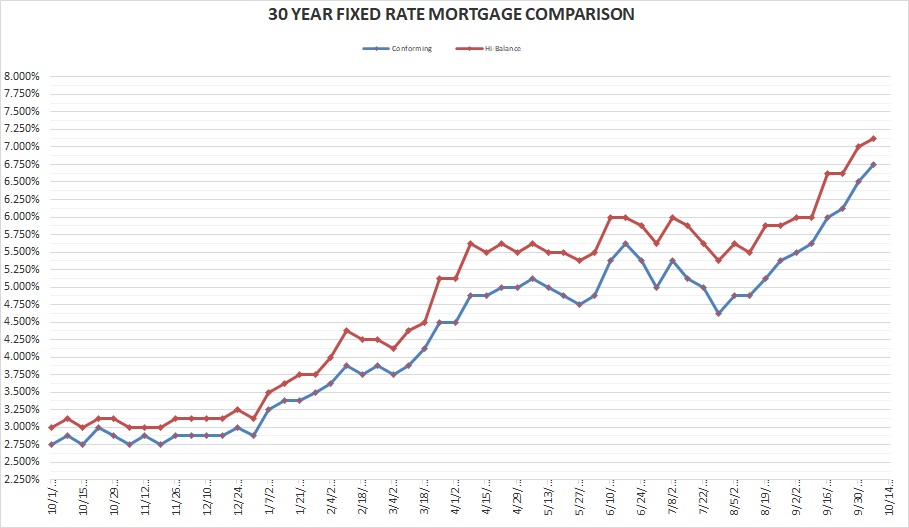
Rates for Friday October 7, 2022: Rates continue their upward march, the conforming rate increasing 0.25% this week, that is over 1% since a month ago. As we are seeing, jobs and GDP are not a factor in rates as they are traditionally. The only metric that has impact is inflation. Until it starts to dramatically decline, high(er) rates will continue.
FIXED RATE MORTGAGES AT COST OF 1.25 POINTS LOCKED FOR 45 DAYS FOR PURCHASE TRANSACTIONS:
30-year conforming 6.750% Up 0.25%
30-year high-balance conforming 7.125% Up 0.125%
Please note that these are base rates and adjustments may be added for condominiums, refinances, credit scores, loan to value, no impound account and period rate is locked. Rates are based on 20% down with 740 FICO score for purchase mortgages.
If you notice more than the normal amount of tipohs, badly grammar, and other misteaks this week it is because I have been writing the WR&MU with the Phillies playoff game against the Cards on while i right.
Go Phillies! Ring the Bell!
Have a great week,
Dennis
Past Weekly Rate & Market Updates can be found on my blog page at my website www.DennisCSmith.com/my-blog


