

Is the market cooling?
Question of the week: Is the market cooling?
Answer: According to my Magic 8-Ball, and statistics from the California Association of Realtors, most likely.
Markets by Goldilocks, if the market is cool there is more supply than demand, if the market is hot there is more demand than supply, if the market is just right there is balance between supply and demand.
The past several years has seen considerably more demand than supply, as a result prices have soared.
In the last sixty-six months, from January 2020 just before the pandemic, through June 2025 the median priced home in Los Angeles County increased 46% (up from $617,250 to $903,650); Orange County saw an incredible 72% increase in median price ($855,000 to $1,470,000). Statewide the median price climbed from $525,160 to $899,560, a 62% rise.
Prices for LA County, up 8.2% from May and 1.6% year-to-year, Orange Country, 3.6% higher for the month, don’t reflect a “cooling” market; though the .1% price decline from May and June 2024 statewide does.
Prices are the final data point for sales, leading to sales and closings are properties on the market and properties in escrow pending closings. This data affirms the 8-Ball’s response.
Statewide unsold inventory, homes active on the market, is up 26.7% from last year, which equates to 3.8 months of inventory at the current sales rates. In the Southern California region inventory is at 3.9 months.
In hot markets homes do not stay on the market very long. Statewide the average days on the market is up 33.3% from last year at 24 days from listing to sale (not closing), in Southern California the average days on the market is 27.
Southern California led all regions with an increase in sales from last June, up 1.9%, statewide sales dropped 0.3%, the third month in a row year-over-years sales have declined across California.
After several years with sales prices exceeding listing prices, in Southern California and across the state, sales prices are below list price; selling at 99.3% statewide and 99.2% in Southern California.
Pending sales, properties under contract and off the market but not yet closed, are down 6.4% to the lowest level since the beginning of the year.
Active listings, i.e. market supply, are at their highest since June 2019, when mortgage rates hit their lowest mark 3.625%, since January 2018. Listings are up 42.5% across California and up 47% in the Southern California region.
It should be noted that the Southern California region, defined as Imperial, Los Angeles, Orange, Riverside, San Bernardino, San Diego and Ventura Counties, greatly influence the statewide statistics. The region accounted for 43% of all sales in the state in May, next closest at 22% were the Central Valley and San Francisco/Bay Area.
Number of sales and median prices are not directly linked. We have seen historically low sales with historically high prices as demand far outweighed supply. During Covid we saw very high sales volume and rising prices as homes were snatched up as move-up buyers flooded the market with supply and demand.
Moving forward we will likely see sale an increase in sales and, depending on the market, prices increasing in smaller amounts, staying the same, or slightly declining, as inventory sits and more buyers come to market.
Have a question? Ask me!
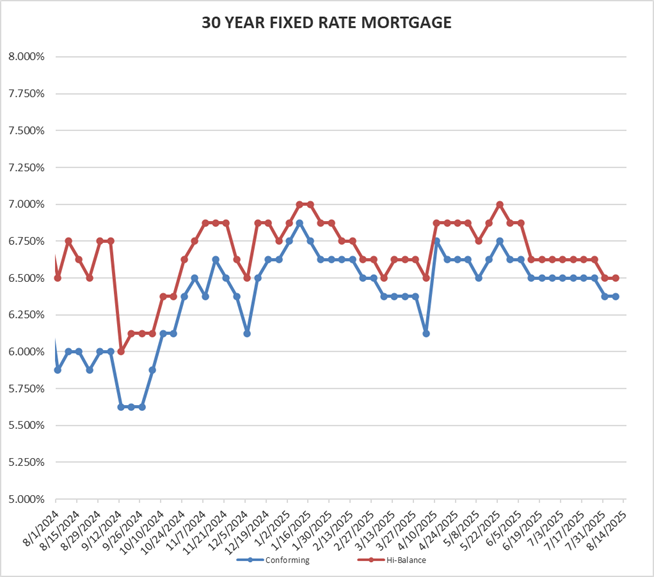
Rates for Friday August 8, 2025: After all the data last week, investors took a deep breath this week and rates are flat from last Friday. With new tariffs now in place for most trading partners, investors will be looking closely at prices and jobs, perhaps over or under reading data which could lead to some choppy times ahead.
FIXED RATE MORTGAGES AT COST OF 1.25 POINTS LOCKED FOR 45 DAYS:
30 year conforming 6.375% Flat
30 year high-balance conforming 6.50% Flat
Please note that these are base rates and adjustments may be added for condominiums, refinances, credit scores, loan to value, no impound account and period rate is locked. Rates are based on 20% down with 740 FICO score for purchase mortgages.
On Wednesday I was proud to join fellow Long Beach Rotarians at Long Beach City College where after our lunch we filled 750 bags with either food or hygiene items in about 25 minutes. These bags will go in the food pantry at the college for students who are facing housing and or food insecurity.
In January we will duplicate the effort at Long Beach State.
Called “Feeding the Future,” the Rotary Club of Long Beach has been assisting both schools since 2019 and have positively impacted thousands of students with food, hygiene products, supplies, gift cards, and their knowing people care about them and support them in their pursuit of higher education.
In addition to supporting students as CSULB and LBCC with our Feeding the Future projects, our club’s scholarship foundation is the number one donor of scholarships to LBCC and the second largest scholarship benefactor to CSULB, over the year over 5,000 scholarships totaling over $6,000,000 have been granted to students at the two institutions.
September is National Student Parent Month. As part of this Long Beach City College will be hosting “September Showers” to assist their students parents, with donation bins at their two campuses if you care to participate. Suggested donations items are baby wipes, diapers, unused toys and unused clothing.
If you wish to financially support their effort click here for your generous contribution.


