

What is happening with home sales?
Question of the week: What is happening with home sales?
Answer: Depending on the area, sales are a mixed bag. Some areas are seeing higher sales and lower prices, others showing higher sales and prices, some are showing lower sales and higher prices.
Let’s dig into some data from the California Association of Realtors numbers from May.
Statewide the median price climbed to an all-time high in May to $908,040. The climb in the statewide median has been largely due to upper end home sales growing as to the percentage of overall sales—particularly the $2 million and up properties.
The median price was up 0.4% from April’s $904,440 and up 8.7% from the $835,250 median price. Sales were down 1.1% from April and 6% from 2023, indicating there is still a lack of supply in the market.
Looking locally to where most of the WR&MU readers are located…
For the sixth time in the last eight months, the median price home in Los Angeles County dropped from the prior month, to $811,610 in May from $825,970 in April. That represents a 1.7% decline; however, May’s median is 9.0% higher than May 2023 median price of $744,770. Indicating an increase in the first-time buyer and more affordable home sales, the median price declined from April but the number of sales increased by 11.7%. Year over year May’s sales were down 2.6% from last year. The data indicates a growing supply in the market compared to the number of buyers.
Note for local agents in Long Beach area (who I interact with the most) thinking, “supply is still lacking to demand, most homes on the market have multiple offers. The imbalance is too little homes for too many buyers.” The data is for all of Los Angeles County, from Lancaster to Long Beach, from Hermosa Beach to Pomona.)
Orange County also saw an increase in “lower” priced sales in May as its median price declined for the first time since October 23, 2023, dropping from $1,440,000 to $1,422,500. The month-to-month drop is 1.2%, year over year the median price is up 13.2% from last May’s $1,256,500. Sales in the OC went up 11.9% for the month and 12.2% from last May.
Interest rates continue to constrain the move up market, which continues to limit supply and therefore backs up available homes on the market from top to bottom. Many families wanting a bigger, or smaller, home are very reticent to sell their home with a 3% mortgage with a $2400 payment to purchase a home with a 7.0% mortgage with a $4500 payment.
With anticipation of the Fed lowering its benchmark interest rate in September, and rates soften a bit in anticipation, and mixed economic data over the past several months indicating a slowing economy, those want-to-sell homeowners may soon be coming to market—on both the sell and buy sides, thereby increasing supply and demand.
What are your move up options in today’s market? Schedule an appointment to discuss your options.
Have a question? Ask me!
Murky data this week, murky enough to push rates higher. The final revision to the 1st quarter GDP pushed economic growth to 1.4% after last month’s estimate of 1.3%. The increase was a blip on investors’ screens and no impact on rates. What was interesting in the revision however was the final data on consumer spending showing an increase of only 1.3%, the lowest in two years.
Of greater impact on rates, was the strong personal income increase of 0.5% for the month, up from a .03% increase in April. While personal incomes popped, consumer spending increased 0.2%. The 0.3% gap between earnings and spending indicates that while inflation is pushing wages higher, it is also having consumers pare back on their expenditures. The jump in wages spooked investors as the data can create more inflation as employers raise prices to cover wages.
The final data release of the week was the Personal Consumption Expenditures Index (PCI), the Federal Reserve’s favored inflation index. May’s PCI was flat for the month after a 0.3% increase last month. Year over year, the index increased 2.6%, down from April’s 2.7%. The “core” data (stripping out energy and food due to their volatility), showed a .1% monthly increase, the lowest in seven months, and an increase of 2.6% from last May, a decline from April’s core PCI of 2.7%. With wages significantly outpacing inflation, and spending slowing, we are in a period where it appears the economy could go in a few directions. Mostly, as always, dependent on what consumers decide to do with their increase in income—consumer spending being 65-70% of our economy. Spend the increased incomes spurs the economy, and likely inflation; save the extra money and slow spending and the economy.
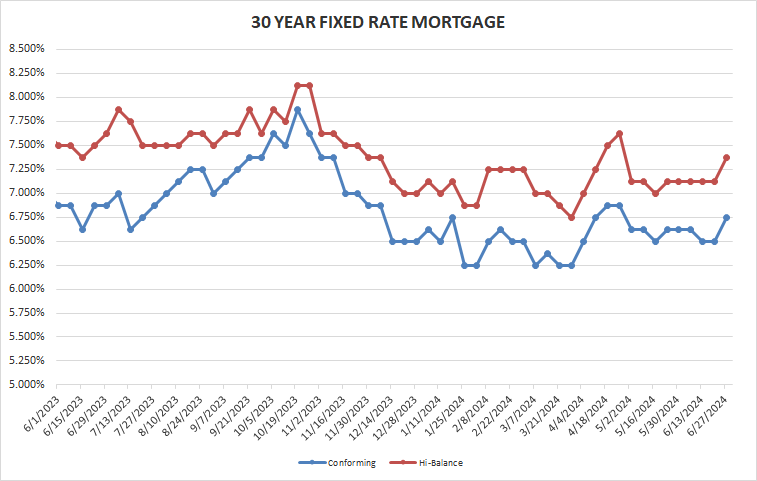
Rates for Friday June 28, 2024: Rates jump this week to their highest levels since April. Part of the jump is the economic data, part is investors pulling out of markets ahead of the holiday week.
FIXED RATE MORTGAGES AT COST OF 1.25 POINTS LOCKED FOR 45 DAYS FOR PURCHASE TRANSACTIONS:
30-year conforming 6.75% Up 0.25%
30-year high-balance conforming 7.375% Up 0.25%
Please note that these are base rates and adjustments may be added for condominiums, refinances, credit scores, loan to value, no impound account and period rate is locked. Rates are based on 20% down with 740 FICO score for purchase mortgages.
There will be no WR&MU next week due to the Independence Day holiday, and day off to celebrate another trip around the sun for yours truly.
Thanks to everyone who replied to last week’s WR&MU with their own baseball stories and heroes. While football may get more attention and television viewers, baseball is still America’s game—at least for me!
Have a wonderful holiday week,
Dennis
Past Weekly Rate & Market Updates can be found on my blog page at my website www.DennisCSmith.com/my-blog
Question of the week: What is happening with home sales?
Answer: Depending on the area, sales are a mixed bag. Some areas are seeing higher sales and lower prices, others showing higher sales and prices, some are showing lower sales and higher prices.
Let’s dig into some data from the California Association of Realtors numbers from May.
Statewide the median price climbed to an all-time high in May to $908,040. The climb in the statewide median has been largely due to upper end home sales growing as to the percentage of overall sales—particularly the $2 million and up properties.
The median price was up 0.4% from April’s $904,440 and up 8.7% from the $835,250 median price. Sales were down 1.1% from April and 6% from 2023, indicating there is still a lack of supply in the market.
Looking locally to where most of the WR&MU readers are located…
For the sixth time in the last eight months, the median price home in Los Angeles County dropped from the prior month, to $811,610 in May from $825,970 in April. That represents a 1.7% decline; however, May’s median is 9.0% higher than May 2023 median price of $744,770. Indicating an increase in the first-time buyer and more affordable home sales, the median price declined from April but the number of sales increased by 11.7%. Year over year May’s sales were down 2.6% from last year. The data indicates a growing supply in the market compared to the number of buyers.
Note for local agents in Long Beach area (who I interact with the most) thinking, “supply is still lacking to demand, most homes on the market have multiple offers. The imbalance is too little homes for too many buyers.” The data is for all of Los Angeles County, from Lancaster to Long Beach, from Hermosa Beach to Pomona.)
Orange County also saw an increase in “lower” priced sales in May as its median price declined for the first time since October 23, 2023, dropping from $1,440,000 to $1,422,500. The month-to-month drop is 1.2%, year over year the median price is up 13.2% from last May’s $1,256,500. Sales in the OC went up 11.9% for the month and 12.2% from last May.
Interest rates continue to constrain the move up market, which continues to limit supply and therefore backs up available homes on the market from top to bottom. Many families wanting a bigger, or smaller, home are very reticent to sell their home with a 3% mortgage with a $2400 payment to purchase a home with a 7.0% mortgage with a $4500 payment.
With anticipation of the Fed lowering its benchmark interest rate in September, and rates soften a bit in anticipation, and mixed economic data over the past several months indicating a slowing economy, those want-to-sell homeowners may soon be coming to market—on both the sell and buy sides, thereby increasing supply and demand.
What are your move up options in today’s market? Schedule an appointment to discuss your options.
Have a question? Ask me!
Murky data this week, murky enough to push rates higher. The final revision to the 1st quarter GDP pushed economic growth to 1.4% after last month’s estimate of 1.3%. The increase was a blip on investors’ screens and no impact on rates. What was interesting in the revision however was the final data on consumer spending showing an increase of only 1.3%, the lowest in two years.
Of greater impact on rates, was the strong personal income increase of 0.5% for the month, up from a .03% increase in April. While personal incomes popped, consumer spending increased 0.2%. The 0.3% gap between earnings and spending indicates that while inflation is pushing wages higher, it is also having consumers pare back on their expenditures. The jump in wages spooked investors as the data can create more inflation as employers raise prices to cover wages.
The final data release of the week was the Personal Consumption Expenditures Index (PCI), the Federal Reserve’s favored inflation index. May’s PCI was flat for the month after a 0.3% increase last month. Year over year, the index increased 2.6%, down from April’s 2.7%. The “core” data (stripping out energy and food due to their volatility), showed a .1% monthly increase, the lowest in seven months, and an increase of 2.6% from last May, a decline from April’s core PCI of 2.7%. With wages significantly outpacing inflation, and spending slowing, we are in a period where it appears the economy could go in a few directions. Mostly, as always, dependent on what consumers decide to do with their increase in income—consumer spending being 65-70% of our economy. Spend the increased incomes spurs the economy, and likely inflation; save the extra money and slow spending and the economy.
Rates for Friday June 28, 2024: Rates jump this week to their highest levels since April. Part of the jump is the economic data, part is investors pulling out of markets ahead of the holiday week.
FIXED RATE MORTGAGES AT COST OF 1.25 POINTS LOCKED FOR 45 DAYS FOR PURCHASE TRANSACTIONS:
30-year conforming 6.75% Up 0.25%
30-year high-balance conforming 7.375% Up 0.25%
Please note that these are base rates and adjustments may be added for condominiums, refinances, credit scores, loan to value, no impound account and period rate is locked. Rates are based on 20% down with 740 FICO score for purchase mortgages.
There will be no WR&MU next week due to the Independence Day holiday, and day off to celebrate another trip around the sun for yours truly.
Thanks to everyone who replied to last week’s WR&MU with their own baseball stories and heroes. While football may get more attention and television viewers, baseball is still America’s game—at least for me!
Have a wonderful holiday week,
Dennis
Past Weekly Rate & Market Updates can be found on my blog page at my website www.DennisCSmith.com/my-blog


